First Release
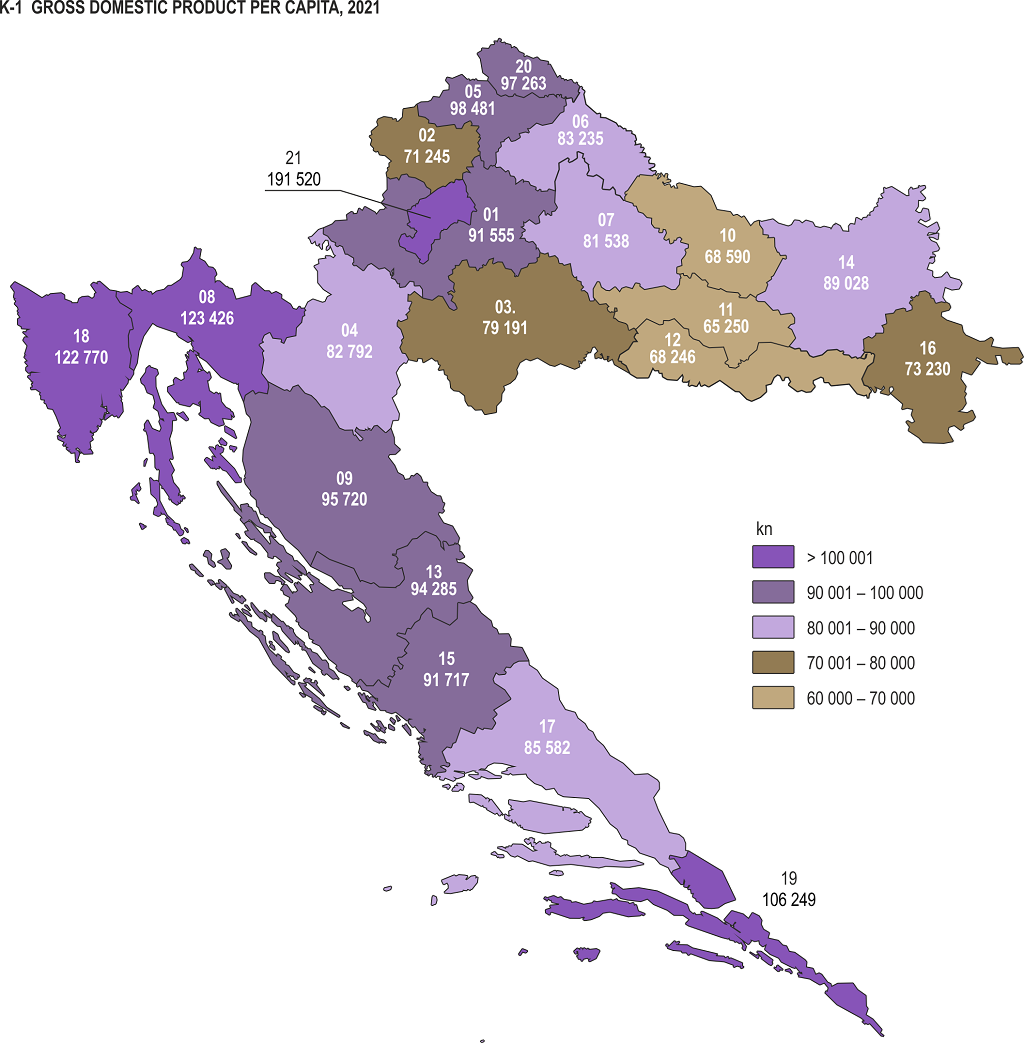
GROSS DOMESTIC PRODUCT FOR REPUBLIC OF CROATIA,
HR_NUTS 2021. – HR NUTS 2 AND COUNTIES, 2021
The Croatian Bureau of Statistics presents data on the gross domestic product (GDP) for the Republic of Croatia, at the level of the HR_NUTS 2021. – HR NUTS 2 and at the level of counties, by economic activities for 2021.
The time series of data on GDP for the Republic of Croatia at the level of the HR_NUTS 2021. – HR NUTS 2 and at the level of counties have been revised for the period from 2000 to 2020.
The revised GDP data for the Republic of Croatia were published on 19 October 2023 in the First Release NR-2023-2-2 ''Annual Gross Domestic Product, 1995 – 2022'', revised data, in which the revision is explained in the Notes on Methodology.
Data series for the period from 2013 to 2021 are available in the attached Excel tables. The data are available at current prices and per capita.
Data are presented according to the methodology of the European System of National and Regional Accounts (ESA 2010).
Regional GDP is an indicator of a region’s output and can therefore be used for measuring and comparing the degree of economic activity of different regions. The regional GDP is not a measure of regional wellbeing or regional income.
The GDP data for the Republic of Croatia, at the level of the HR_NUTS 2021. – HR NUTS 2 and at the level of counties, are based on the final annual GDP data.
The time series of the GDP data are presented according to the National Classification of Activities, 2007 version (NKD 2007).
The population data at the level of the Republic of Croatia, at the level of the HR_NUTS 2021. – HR NUTS 2 and at the level of counties, are based on the Census of Population, Households and Dwellings 2011.
Detailed data can be downloaded on the link Statistics in Line.
1 GROSS DOMESTIC PRODUCT FOR REPUBLIC OF CROATIA AT THE LEVEL OF HR_NUTS 2021. – HR NUTS 2 |
|||||||||||||||||||||||||||||||||||||||||||||||||||||||||||||||||||||||||||||||||||||||||||||||||||||||||||||||||||||||||||||||||||||||||||||||||||||||||||||||||||||||||||||||||||||||||||||||||||||||||||||||||||||||||||||||||||||||||||||||||||||||||||||||||||||||||||||||||||||||||||||||||||||||||||||||||||||||||||||||||||||||||||||||||||||
1) The average for the total population of the Republic of Croatia based on the population estimate from the 2011 Census of Population data. |
|||||||||||||||||||||||||||||||||||||||||||||||||||||||||||||||||||||||||||||||||||||||||||||||||||||||||||||||||||||||||||||||||||||||||||||||||||||||||||||||||||||||||||||||||||||||||||||||||||||||||||||||||||||||||||||||||||||||||||||||||||||||||||||||||||||||||||||||||||||||||||||||||||||||||||||||||||||||||||||||||||||||||||||||||||||
| Counties | |||||
| 01 | County of Zagreb | 08 | County of Primorje-Gorski kotar | 15 | County of Šibenik-Knin |
| 02 | County of Krapina-Zagorje | 09 | County of Lika-Senj | 16 | County of Vukovar-Sirmium |
| 03 | County of Sisak-Moslavina | 10 | County of Virovitica-Podravina | 17 | County of Split-Dalmatia |
| 04 | County of Karlovac | 11 | County of Požega-Slavonija | 18 | County of Istria |
| 05 | County of Varaždin | 12 | County of Slavonski Brod-Posavina | 19 | County of Dubrovnik-Neretva |
| 06 | County of Koprivnica-Križevci | 13 | County of Zadar | 20 | County of Međimurje |
| 07 | County of Bjelovar-Bilogora | 14 | County of Osijek-Baranja | 21 | City of Zagreb |
2 GROSS VALUE ADDED FOR REPUBLIC OF CROATIA AT THE LEVEL OF HR_NUTS 2021. – HR NUTS 2 AND AT THE LEVEL OF COUNTIES, 2021 |
|||||||||||||||||||||||||||||||||||||||||||||||||||||||||||||||||||||||||||||||||||||||||||||||||||||||||||||||||||||||||||||||||||||||||||||||||||||||||||||||||||||||||||||||||||||||||||||||||||||||||||||||||||||||||||||||||||||||||||||||||||||||||||||||||||||||||||||||||||||||||||||||||||||||||||||||||||||||||||||||||||||||||||||||||||||||||||||||||||||||||||
|
Mln kuna
|
|||||||||||||||||||||||||||||||||||||||||||||||||||||||||||||||||||||||||||||||||||||||||||||||||||||||||||||||||||||||||||||||||||||||||||||||||||||||||||||||||||||||||||||||||||||||||||||||||||||||||||||||||||||||||||||||||||||||||||||||||||||||||||||||||||||||||||||||||||||||||||||||||||||||||||||||||||||||||||||||||||||||||||||||||||||||||||||||||||||||||||
| NKD 2007 activity sections | ||||
| A | Agriculture, forestry and fishing | |||
| B | Mining and quarrying | |||
| C | Manufacturing | |||
| D | Electricity, gas, steam and air conditioning supply | |||
| E | Water supply; sewerage, waste management and remediation activities | |||
| F | Construction | |||
| G | Wholesale and retail trade; repair of motor vehicles and motorcycles | |||
| H | Transportation and storage | |||
| I | Accommodation and food service activities | |||
| J | Information and communication | |||
| K | Financial and insurance activities | |||
| L | Real estate activities | |||
| M | Professional, scientific and technical activities | |||
| N | Administrative and support service activities | |||
| O | Public administration and defence; compulsory social security | |||
| P | Education | |||
| Q | Human health and social work activities | |||
| R | Arts, entertainment and recreation | |||
| S | Other service activities | |||
| T | Activities of households as employers; undifferentiated goods and services producing activities of households for own use | |||
| U | Activities of extraterritorial organisations and bodies | |||
NOTES ON METHODOLOGY
The purpose of the statistical survey
The purpose of the statistical survey is to estimate the gross value added (GVA) and the gross domestic product (GDP) for the Republic of Croatia as well as at the level of the HR_NUTS 2021. – HR NUTS 2 and at the level of counties.
Sources and methods of data collection
Data sources for the calculation of GVA and GDP are the national accounts data, annual business statistics surveys, economic accounts for agriculture, annual data on persons in employment and earnings, annual data of the Croatian Institute for Pension Insurance on the number of insured persons and various other statistical data.
Coverage
The calculation covers all activities following the concepts of the System of National Accounts (SNA 2008) and the European System of National and Regional Accounts (ESA 2010).
Definitions
Regional accounts are a subsystem of national accounts in which the Republic of Croatia, units at the level of the HR_NUTS 2021. – HR NUTS 2 and at the level of counties are the main objects of observation. The concepts used in the regional accounts are the same as those used in the national accounts.
GDP at market prices is the sum of values added by activities, including items at the level of the national economy that are not classified by activities, such as taxes on products less subsidies on products.
Other explanations
GVA and GDP for the Republic of Croatia, at the level of the HR_NUTS 2021. – HR NUTS 2 and at the level of counties are calculated by using the indirect method. The national GVA figures by activities were allocated at the level of the HR_NUTS 2021. – HR NUTS 2 and at the level of counties by applying adequate distribution keys.
GDP per capita according to purchasing power standards (PPS) is an indicator that measures the economic development of EU's regions as a percentage of the EU average (EU-27 = 100). It shows how much a region is more or less developed than the average EU development or the general level of economic development of a particular region. It is expressed according to the purchasing power standard, which is an artificial currency unit that eliminates the differences between price levels between countries.
| Abbreviations | |
| EU | European Union |
| EU-27 | European Union (27 Member States) |
| CNB | Croatian National Bank |
| EUR | euro |
| HRK | Croatian kuna |
| mln | million |
| NKD 2007 | National Classification of Activities, 2007 version |
| HR_NUTS 2021. – HR NUTS 2 | National Classification of Statistical Regions – level 2 statistical regions, 2021 version |
Published by the Croatian Bureau of Statistics, Zagreb, Ilica 3, P. O. B. 80
Phone: (+385 1) 48 06 111
Press corner: press@dzs.hr
Persons responsible:
Suzana Šamec, Director of Macroeconomic Statistics Directorate
Lidija Brković, Director General
Prepared by:
Ingrid Pejković and Patrik Pipp
USERS ARE KINDLY REQUESTED TO STATE THE SOURCE.
Customer Relations and Data Protection Department
Information and user requests
Phone: (+385 1) 48 06 138, 48 06 154, 48 06 115
E-mail: stat.info@dzs.hr
Subscription
Phone: (+385 1) 21 00 455
E-mail: prodaja@dzs.hr
Ilica 3, 10 000 Zagreb
Republika Hrvatska
Telefon: (+385 1) 48 06 111
Elektronička pošta: stat.info@dzs.hr
Copyright © 2024 Republika Hrvatska - Državni zavod za statistiku