First Release
INDUSTRIAL PRODUCER PRICE INDEX, MARCH 2022
Producer prices of industrial products (total)
In March 2022, producer prices of industrial products for total industry increased by 3.4% compared to February 2022. As compared to March 2021, they increased by 19.5%.
Comparison of producer prices of industrial products for total industry, excluding Energy, shows that in March 2022 they increased by 0.9% compared to February 2022 and by 6.9% compared to March 2021.
Producer prices of industrial products on the domestic market (total)
In March 2022, producer prices of industrial products on the domestic market for total industry increased by 3.9% compared to February 2022 and by 24.7% compared to March 2021.
Comparison of producer prices of industrial products on the domestic market for total industry, excluding Energy, shows that in March 2022 they increased by 1.1% compared to February 2022 and by 6.8% compared to March 2021.
G-1 INDUSTRIAL PRODUCER PRICE INDEX ON DOMESTIC MARKET, MARCH 2018 – MARCH 2022
Producer prices of industrial products on the non-domestic market (total)
In March 2022, producer prices of industrial products on the non-domestic market for total industry increased by 2.9% compared to February 2022. As compared to March 2021, they increased by 13.0%.
Comparison of producer prices of industrial products on the non-domestic market for total industry, excluding Energy, shows that in March 2022 they increased by 0.7% compared to February 2022 and by 7.0% compared to March 2021.
MIGs 2009. aggregates
Producer prices of industrial products (total)
In March 2022, as compared to February 2022, producer prices of industrial products increased in Energy by 15.0%, in Intermediate goods and in Non-durable consumer goods by 1.0% (in each group), in Durable consumer goods by 0.6% and in Capital goods by 0.3%.
In March 2022, as compared to March 2021, producer prices of industrial products increased in Energy by 76.4%, in Intermediate goods by 10.7%, in Durable consumer goods by 7.4%, in Capital goods by 4.3% and in Non-durable consumer goods by 4.2%.
Producer prices of industrial products on the domestic market
In March 2022, as compared to February 2022, producer prices of industrial products increased in Energy by 11.1%, in Non-durable consumer goods by 1.3%, in Intermediate goods by 1.1%, in Durable consumer goods by 0.5% and in Capital goods by 0.4%.
In March 2022, as compared to March 2021, producer prices of industrial products increased in Energy by 73.3%, in Intermediate goods by 9.9%, in Durable consumer goods by 6.0%, in Non-durable consumer goods by 5.6% and in Capital goods by 3.5%.
G-2 INDUSTRIAL PRODUCER PRICE INDEX ON DOMESTIC AND NON-DOMESTIC MARKET, PRICE CHANGES COMPARED WITH PREVIOUS MONTH, MARCH 2022
| MIGs 2009. | NKD 2007. sections | ||
| AI | Intermediate goods | B | Mining and quarrying |
| AE | Energy | C | Manufacturing |
| BB | Capital goods | D | Electricity, gas, steam and air conditioning supply |
| CD | Durable consumer goods | E | Water supply; sewerage, waste management |
| CN | Non-durable consumer goods | and remediation activities | |
Producer prices of industrial products on the non-domestic market
In March 2022, as compared to February 2022, producer prices increased in Energy by 36.3%, in Intermediate goods by 0.9%, in Durable consumer goods by and in Non-durable consumer goods by 0.6% (in each group) and in Capital goods by 0.3%.
In March 2022, as compared to March 2021, producer prices increased in Energy by 105.1%, in Intermediate goods by 11.4%, in Durable consumer goods by 8.1%, in Capital goods by 4.8% and in Non-durable consumer goods by 2.1%.
NKD 2007. industrial sections
Producer prices of industrial products (total)
In March 2022, as compared to February 2022, producer prices increased in Manufacturing by 3.6%, in Mining and quarrying by 2.3%, in Electricity, gas, steam and air conditioning supply by 2.2% and in Water supply; sewerage, waste management and remediation activities (only division 36) by 0.1%.
In March 2022, as compared to March 2021, producer prices increased in Mining and quarrying by 220.2%, in Electricity, gas, steam and air conditioning supply by 17.6%, in Manufacturing by 13.8% and in Water supply; sewerage, waste management and remediation activities (only division 36) by 0.5%.
Producer prices of industrial products on the domestic market
In March 2022, as compared to February 2022, producer prices increased in Manufacturing by 4.4%, in Mining and quarrying by 2.4%, in Electricity, gas, steam and air conditioning supply by 2.2% and in Water supply; sewerage, waste management and remediation activities (only division 36) by 0.1%.
In March 2022, as compared to March 2021, producer prices increased in Mining and quarrying by 225.7%, in Electricity, gas, steam and air conditioning supply by 17.6%, in Manufacturing by 14.5% and in Water supply; sewerage, waste management and remediation activities (only division 36) by 0.5%.
G-3 INDUSTRIAL PRODUCER PRICE INDEX ON DOMESTIC AND NON-DOMESTIC MARKET, PRICE CHANGES COMPARED WITH SAME MONTH OF PREVIOUS YEAR, MARCH 2022
| MIGs 2009. | NKD 2007. sections | ||
| AI | Intermediate goods | B | Mining and quarrying |
| AE | Energy | C | Manufacturing |
| BB | Capital goods | D | Electricity, gas, steam and air conditioning supply |
| CD | Durable consumer goods | E | Water supply; sewerage, waste management |
| CN | Non-durable consumer goods | and remediation activities | |
Producer prices of industrial products on the non-domestic market
In March 2022, as compared to February 2022, producer prices increased in Electricity, gas, steam and air conditioning supply by 9.2%, in Manufacturing by 2.9% and in Mining and quarrying by 0.1%.
In March 2022, as compared to March 2021, producer prices increased in Electricity, gas, steam and air conditioning supply by 56.3%, in Manufacturing by 13.0% and in Mining and quarrying by 3.3%.
1 INDUSTRIAL PRODUCER PRICE INDICES ON DOMESTIC MARKET, NON-DOMESTIC MARKET AND TOTAL, ACCORDING TO MIGs 2009. AND NKD 2007. SECTIONS AND DIVISIONS, MARCH 2022 |
|||||||||||||||||||||||||||||||||||||||||||||||||||||||||||||||||||||||||||||||||||||||||||||||||||||||||||||||||||||||||||||||||||||||||||||||||||||||||||||||||||||||||||||||||||||||||||||||||||||||||||||||||||||||||||||||||||||||||||||||||||||||||||||||||||||||||||||||||||||||||||||||||||||||||||||||||||
|
|||||||||||||||||||||||||||||||||||||||||||||||||||||||||||||||||||||||||||||||||||||||||||||||||||||||||||||||||||||||||||||||||||||||||||||||||||||||||||||||||||||||||||||||||||||||||||||||||||||||||||||||||||||||||||||||||||||||||||||||||||||||||||||||||||||||||||||||||||||||||||||||||||||||||||||||||||
G-4 INDUSTRIAL PRODUCER PRICE INDEX ON DOMESTIC AND NON-DOMESTIC MARKET, ACCORDING TO NKD 2007. DIVISIONS, PRICE CHANGES COMPARED WITH PREVIOUS MONTH, MARCH 2022
G-5 INDUSTRIAL PRODUCER PRICE INDEX ON DOMESTIC AND NON-DOMESTIC MARKET, ACCORDING TO NKD 2007. SECTIONS, PRICE CHANGES COMPARED WITH SAME MONTH OF PREVIOUS YEAR, MARCH 2022
| NKD 2007. Divisions | |
| 06 | Extraction of crude petroleum and natural gas |
| 08 | Other mining and quarrying |
| 09 | Mining support service activities |
| 10 | Manufacture of food products |
| 11 | Manufacture of beverages |
| 12 | Manufacture of tobacco products |
| 13 | Manufacture of textiles |
| 14 | Manufacture of wearing apparel |
| 15 | Manufacture of leather and related products |
| 16 | Manufacture of wood and of products of wood and cork, except furniture; |
| manufacture of articles of straw and plaiting materials | |
| 17 | Manufacture of paper and paper products |
| 18 | Printing and reproduction of recorded media |
| 19 | Manufacture of coke and refined petroleum products |
| 20 | Manufacture of chemicals and chemical products |
| 21 | Manufacture of basic pharmaceutical products and pharmaceutical preparations |
| 22 | Manufacture of rubber and plastic products |
| 23 | Manufacture of other non-metallic mineral products |
| 24 | Manufacture of basic metals |
| 25 | Manufacture of fabricated metal products, except machinery and equipment |
| 26 | Manufacture of computer, electronic and optical products |
| 27 | Manufacture of electrical equipment |
| 28 | Manufacture of machinery and equipment n. e. c. |
| 29 | Manufacture of motor vehicles, trailers and semi-trailers |
| 30 | Manufacture of other transport equipment |
| 31 | Manufacture of furniture |
| 32 | Other manufacturing |
| 33 | Repair and installation of machinery and equipment |
| 35 | Electricity, gas, steam and air conditioning supply |
| 36 | Water collection, treatment and supply |
2 INDUSTRIAL PRODUCER PRICE INDICES ON DOMESTIC MARKET, ACCORDING TO MIGs 2009. AND TO NKD 2007. SECTIONS AND DIVISIONS, MARCH 2022 |
|||||||||||||||||||||||||||||||||||||||||||||||||||||||||||||||||||||||||||||||||||||||||||||||||||||||||||||||||||||||||||||||||||||||||||||||||||||||||||||||||||||||||||||||||||||||||||||||||||||||||||||||||||||||||||||||||||||||||||||||||||||||||||||||||||||||||||||||||||||||||||||||||||||||||||||||||||||||||||||||||||||||||||||||||||||||||||||||
|
2015 = 100
|
|||||||||||||||||||||||||||||||||||||||||||||||||||||||||||||||||||||||||||||||||||||||||||||||||||||||||||||||||||||||||||||||||||||||||||||||||||||||||||||||||||||||||||||||||||||||||||||||||||||||||||||||||||||||||||||||||||||||||||||||||||||||||||||||||||||||||||||||||||||||||||||||||||||||||||||||||||||||||||||||||||||||||||||||||||||||||||||||
3 INDUSTRIAL PRODUCER PRICE INDICES ON NON-DOMESTIC MARKET, ACCORDING TO MIGs 2009. AND TO NKD 2007. SECTIONS AND DIVISIONS, MARCH 2022 |
|||||||||||||||||||||||||||||||||||||||||||||||||||||||||||||||||||||||||||||||||||||||||||||||||||||||||||||||||||||||||||||||||||||||||||||||||||||||||||||||||||||||||||||||||||||||||||||||||||||||||||||||||||||||||||||||||||||||||||||||||||||||||||||||||||||||||||||||||||||||||||||||||||||||||||||||||||||||||||||||||||||||||||||||||||||||||||||||
|
2015 = 100
|
|||||||||||||||||||||||||||||||||||||||||||||||||||||||||||||||||||||||||||||||||||||||||||||||||||||||||||||||||||||||||||||||||||||||||||||||||||||||||||||||||||||||||||||||||||||||||||||||||||||||||||||||||||||||||||||||||||||||||||||||||||||||||||||||||||||||||||||||||||||||||||||||||||||||||||||||||||||||||||||||||||||||||||||||||||||||||||||||
4 INDUSTRIAL PRODUCER PRICE INDICES, TOTAL AND ACCORDING TO MIGs 2009. AND TO NKD 2007. SECTIONS AND DIVISIONS, MARCH 2022 |
|||||||||||||||||||||||||||||||||||||||||||||||||||||||||||||||||||||||||||||||||||||||||||||||||||||||||||||||||||||||||||||||||||||||||||||||||||||||||||||||||||||||||||||||||||||||||||||||||||||||||||||||||||||||||||||||||||||||||||||||||||||||||||||||||||||||||||||||||||||||||||||||||||||||||||||||||||||||||||||||||||||||||||||||||||||||||||||||
|
2015 = 100
|
|||||||||||||||||||||||||||||||||||||||||||||||||||||||||||||||||||||||||||||||||||||||||||||||||||||||||||||||||||||||||||||||||||||||||||||||||||||||||||||||||||||||||||||||||||||||||||||||||||||||||||||||||||||||||||||||||||||||||||||||||||||||||||||||||||||||||||||||||||||||||||||||||||||||||||||||||||||||||||||||||||||||||||||||||||||||||||||||
G-6 INDUSTRIAL PRODUCER PRICE INDEX ON DOMESTIC MARKET, TOTAL INDUSTRY AND ACCORDING TO MIGs 2009.
5 MONTHLY INDUSTRIAL PRODUCER PRICE INDICES ON DOMESTIC MARKET, TOTAL INDUSTRY |
|||||||||||||||||||||||||||||||||||||||||||||||||||||||||||||||||||||||||||||||||||||||||||||||||||||||||||||||||||||||||||||||||||||||||||||||||||||||||||||||||||||||||||||||||||||||||||||||||||||||||||||||||||||||||||||||||||||||||||||||||||||||||||||||||||||||||||||||||||||||||||||||||||||||||||||||||||||||||||||||||||||||||||||||||||||||||||||||
|
6 MONTHLY INDUSTRIAL PRODUCER PRICE INDICES ON NON-DOMESTIC MARKET, TOTAL INDUSTRY |
||||||||||||||||||||||||||||||||||||||||||||||||||||||||||||||||||||||||||||||||||||||||||||||||||||||||||||||||||||||||||||||||||||||||||||||||||||||||||||||||||||||||||||||||||||||||||||||||||||||||||||||||||||||||||||||||||||||||||||||||||||||||||||||||||||||||||||||||||||||||||||||||||||||||||||||||||||||||
|
7 MONTHLY TOTAL INDUSTRIAL PRODUCER PRICE INDICES, TOTAL INDUSTRY |
||||||||||||||||||||||||||||||||||||||||||||||||||||||||||||||||||||||||||||||||||||||||||||||||||||||||||||||||||||||||||||||||||||||||||||||||||||||||||||||||||||||||||||||||||||||||||||||||||||||||||||||||||||||||||||||||||||||||||||||||||||||||||||||||||||||||||||||||||||||||||||||
|
8 AVERAGE ANNUAL INDUSTRIAL PRODUCER PRICE INDICES, TOTAL, ON DOMESTIC AND NON-DOMESTIC MARKET |
|||||||||||||||||||||||||||||||||||||||||||||||||||||||||||||||||||||||||||||||||||
|
|||||||||||||||||||||||||||||||||||||||||||||||||||||||||||||||||||||||||||||||||||
NOTES ON METHODOLOGY
Introduction
Industrial producer price indices on the domestic, non-domestic and total market are presented on an interannual chain and on a month-on-month basis as well as on the fixed base year 2015 = 100 due to the harmonisation with the Regulation (EU) No. 2019/2152 of the European Parliament and of the Council of 27 November 2019 on European business statistics, repealing 10 legal acts in the field of business statistics.
Concepts, definitions and terminology are completely harmonised in this First Release with those used and regulated by the EU. Therefore, the term "industrial producers’ price index” has been changed to “industrial producer price index”.
According to the EU terminology, the term “industrial producer price index” is also known as the “industrial output index” and the term “industrial producer prices” should be considered its synonym. If not specified, the term “industrial producer price index” denotes the “total industrial producer price index” (on the domestic and the non-domestic market).
The concept of industrial producer prices and their purpose
Total industrial producer price index is composed of two sub-indices, that is, the industrial producer price index on the domestic market and the industrial producer price index on the non-domestic market. The combination of sub-indices for these two markets provides the changes in given products/services, while their aggregation provides the divisions of products and activities.
Industrial producer price index measures the changes of producer prices of manufactured goods produced in the Republic of Croatia and sold by producers on the domestic (Croatian) and/or the non-domestic (non-Croatian) market.
Industrial producer price index on the domestic market measures the changes of producer prices of manufactured goods that are produced and sold by producers on the domestic (Croatian) market.
Industrial producer price index on the non-domestic market measures the changes of producer prices of manufactured goods that are sold by producers on foreign (non-Croatian) market.
The industrial producer price index is an important short-term indicator of the business cycle that shows monthly price changes in the total industrial sector (the NKD 2007. sections B, C, D and E – only division 36) on the domestic and the non-domestic market. According to the EU concept, it is an important business indicator that permits monthly monitoring of prices at different stages of the manufacturing process. It is also used for distinguishing effective growth of an activity due to price changes and provides information to the business community on particular markets of their interest. It can also indicate inflationary changes before they reach consumers.
Presentation of the industrial producer price index
In this First Release, all indices are presented in gross (unadjusted) form. They were calculated on the basis of data collected through the revised Monthly Survey on Industrial Producer Prices (IND-3/KPS/M form) for 2022.
Legal and methodological framework
The Monthly Survey on Industrial Producer Prices (IND-3/KPS/M form) in 2022 is carried out directly by the Croatian Bureau of Statistics on the basis of the Official Statistics Act (NN, No. 25/20). The internet application (CAWI method) is used in data collection. The reporting units directly access this application and enter their data on the basis of the instructions given.
The concepts and definitions used in the IND-3/KPS/M Survey are harmonised with the EU concepts and definitions, especially with the Regulation (EU) No. 2019/2152 of the European Parliament and of the Council and the Commission Regulation (EU) No. 2020/1197.
Scope and coverage
The reporting units included in the IND-3/KPS/MSurvey are selected enterprises (legal entities and tradesmen) that produce selected products as defined in the Nomenclature of Industrial Products – NIP 2020., classified in the NKD 2007. (NN, Nos 58/07 and 72/07) activity sections B Mining and quarrying, C Manufacturing, D Electricity, gas, steam and air conditioning supply and E Water supply; sewerage, waste management and remediation activities (only division 36).
In order to collect data on industrial producer prices on the domestic and the non-domestic market, the IND-3/KPS/M Survey for 2022 covers a representative sample of industrial products at the level of covered activity classes of the NKD 2007., that is, all products exceeding 20 million kuna on the domestic market and 15 million kuna on the non-domestic market according to the results of the PRODCOM Survey on Industrial Production (IND-21/PRODCOM/G form) for 2020, while the selection of enterprises has been done according to their share in the production of selected products, separately for the domestic and the non-domestic market.
For monitoring the industrial producer prices on the domestic market, the sample for the IND-3/KPS/M Survey for 2022 covers 2 021 item prices within the selected NIP 2020. products in 1 191 enterprises (legal entities and tradesmen), while for monitoring industrial producer prices on the non-domestic market, it covers 1 198 item prices within the selected NIP 2020. products in 712 enterprises (legal entities and tradesmen). In March 2022, the response rate was 97.8%, while the estimation rate of non-responded questionnaires was 2.2%.
Reference point
All industrial producer prices are recorded as transaction prices in effect on the 15th day of the month indicated. The prices at which a producer sells products at the domestic and/or the non-domestic market in the largest quantities to known buyer are recorded.
Completed IND-3/KPS/M forms are delivered directly on the website of the Croatian Bureau of Statistics in the period from 16th to 26th of the current reporting month (https://podaci.dzs.hr/en/).
Definitions
Producer price indices on the domestic and the non-domestic market require a separate compilation according to the destination of a product in order to obtain the producer price indices on the domestic and the non-domestic market.
The residency of the third party that has ordered or purchased the product determines the destination. The domestic market is defined when both the third party/buyer and the reporting unit are residents of the Republic of Croatia, while the non-domestic market is defined when the third party/buyer is not a resident of the Republic of Croatia.
Industrial producer prices on the domestic market are either the prices at which a producer sells products on the domestic market in the largest quantities, loaded free on a rail (truck) at a factory gate at the location of the producer or the price charged to another company by the producer. The selling price is increased for the amount of the compensation obtained by the seller and deducted for the amount of the discount and rebate as well as the value added tax and excises.
Industrial producer prices on the non-domestic market are prices at which a producer sells products on the domestic market (outside Croatia) in the largest quantities at the national border, FOB (free on board). The selling price is increased for the amount of the compensation obtained by the seller and deducted for the amount of the discount and rebate as well as the value added tax and excises. The reporting units present prices in the national currency – kuna and lipa. The prices expressed in a foreign currency are converted into the national currency on the basis of the mean exchange rate of the Croatian National Bank on the 15th day of the reference month.
Calculation method
Total industrial producer price index is composed of two subindices, that is, the industrial producer price index on the domestic market and the industrial producer price index on the non-domestic market.
Industrial producer price indices on the domestic market and the non-domestic market are calculated according to the Laspeyres formula for different levels of the NKD 2007.
Individual indices for each representative product are calculated from data on prices by dividing prices of the current period by prices of the base period (December of the previous year).
Aggregate indices, that is, indices of groups, divisions and sections of the NKD 2007. as well as the total industry index are calculated by a weighted arithmetic mean from individual indices according to the modified Laspeyres formula:
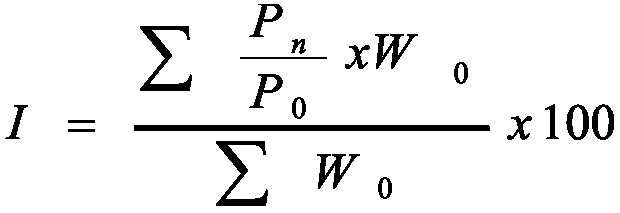

Whereby:
I is an index of a group, division, section, subsection and the total index
Pn is a price in the current period (month)
Po is a price in the base period
Wo is the relative sale structure in the base period.
Weights
The weighting system for 2022 reference year is based on the value of products sold from the PRODCOM Survey on Industrial Production (IND-21/PRODCOM/G form) for 2020. The weighting system is changed at the beginning of every reference year in relation to changes in prices.
Data publishing
The total industrial producer price indices, both on the domestic and the non-domestic market, are published for the total industry according to the NKD 2007. sections and divisions and according to MIGs 2009. aggregates (end use of products) grouped by the NKD 2007. activity groups and divisions. The grouping of the NKD 2007. activity groups or divisions according to the MIGs 2009.1), using alphabetic marks of abbreviations, was done as follows:
| AI | Intermediate goods: the NKD 2007. divisions and groups: 07 (excl. 07.21) – 09, 10.6, 10.9, 13.1 – 13.3, 16, 17, 20.1 – 20.3, 20.5, 20.6, 22 – 24 (excl. 24.46), 25.5 – 25.7, 25.9, 26.1, 26.8, 27.1 – 27.4 and 27.9 |
| AE | Energy: the NKD 2007. divisions: 05, 06, 19, 35 and 36 |
| BB | Capital goods: the NKD 2007. divisions and groups: 25.1 – 25.3, 26.2, 26.3, 26.5, 26.6, 28, 29, 30.2, 32.5 and 33 |
| CD | Durable consumer goods: the NKD 2007. divisions and groups: 26.4, 26.7, 27.5, 30.9, 31, 32.1 and 32.2 |
| CN | Non-durable consumer goods: the NKD 2007. divisions and groups: 10.1 – 10.5, 10.7, 10.8, 11, 12, 13.9, 14, 15, 18, 20.4, 21, 32.3, 32.4 and 32.9. |
1) The Commission Regulation (EU) No. 2020/1197 of 30 July 2020 laying down technical specifications and arrangements pursuant to Regulation (EU) 2019/2152 of the European Parliament and of the Council as regards the definitions of Main Industrial Groupings (MIGs).
![]()

The survey whose data are published in this First Release has been conducted with the financial assistance of the European Union. The contents of this document are the sole responsibility of the Croatian Bureau of Statistics and can under no circumstances be regarded as reflecting the position of the European Union.
| Abbreviations | |
| CAWI | computer-assisted web interview |
| EU | European Union |
| excl. | excluding |
| MIGs 2009. | Main Industrial Groupings, 2009 version |
| NKD 2007. | National Classification of Activities, 2007 version |
| NN | Narodne novine, official gazette of the Republic of Croatia |
| n. e. c. | not elsewhere classified |
| PRODCOM | PRODucts of the European COMmunity |
| Symbols | |
| ... | data not available |
Published by the Croatian Bureau of Statistics, Zagreb, Ilica 3, P. O. B. 80
Phone: (+385 1) 48 06 111
Press corner: press@dzs.hr
Persons responsible:
Milenka Primorac Čačić, Director of Business Statistics Directorate
Lidija Brković, Director General
Prepared by:
Ivana Zoroja Milić, Goran Dolšak and Luka Mihelj
USERS ARE KINDLY REQUESTED TO STATE THE SOURCE.
Customer Relations and Data Protection Department
Information and user requests
Phone: (+385 1) 48 06 138, 48 06 154
E-mail: stat.info@dzs.hr
Subscription
Phone: (+385 1) 48 06 115
E-mail: prodaja@dzs.hr
Ilica 3, 10 000 Zagreb
Republic of Croatia
Phone: (+385 1) 48 06 111
E-Mail: stat.info@dzs.hr
Copyright © 2024 Republic of Croatia - Croatian Bureau of Statistics