According to the mid-2021 population estimate, the Republic of Croatia had 3 878 981 inhabitants, out of which there were 1 867 955 men and 2 011 026 women.
The share of women in the total population of the Republic of Croatia was 51.8%, while the share of men was 48.2%. Such a ratio was recorded in most counties. The lowest share of female population was recorded in the County of Lika-Senj (50.4%), while the largest share was recorded in the City of Zagreb (53.3%).
In 2021, the continuous ageing of the population kept on. The average age of the total population of the Republic of Croatia was 44.3 years (men 42.5, women 45.9), which places it among the oldest nations in Europe.
The ageing process was to a great degree caused by the multi-year drop in the share of youth (0 – 19 years of age) in the total population. At the country level, this share amounted to 19.2% in 2021, while at the county level, it was the lowest in the County of Primorje-Gorski kotar (16.6%) and the highest in the County of Međimurje (21.5%).
The share of the fertile contingent in the total female population continued to decrease. Therefore, in 2021, it amounted to 40.0%.
As compared to the total population, the largest number of persons aged 65 and over was recorded in the County of Šibenik-Knin (27.3%) and the County of Lika-Senj (26.2%), while the smallest number was recorded in the City of Zagreb (20.6%) and in the County of Međimurje (20.5%).
In the Republic of Croatia, 52.0% of the population lived in only five counties, most of them in the City of Zagreb (768 054 or 19.8%) and the County of Split-Dalmatia (423 849 or 10.9%), while the least populated counties were the County of Požega-Slavonia (64 384 or 1.7%) and the County of Lika-Senj (42 931 or 1.1%).
1 MID-YEAR TOTAL POPULATION ESTIMATE OF REPUBLIC OF CROATIA, BY COUNTIES, 2017 – 2021
County of
2017.1)
2018.1)
2019.1)
2020.1)
2021.2)
Republic of Croatia
4 124 531
4 087 843
4 065 253
4 047 680
3 878 981
Zagreb
311 416
309 469
309 169
309 463
299 983
Krapina-Zagorje
126 334
125 357
124 517
124 110
120 670
Sisak-Moslavina
152 546
148 589
145 904
143 618
140 131
Karlovac
118 263
116 829
115 484
114 269
112 357
Varaždin
168 560
166 982
166 112
165 357
159 747
Koprivnica-Križevci
109 137
107 711
106 367
105 385
101 358
Bjelovar-Bilogora
109 822
107 909
106 258
104 908
102 205
Primorje-Gorski kotar
286 677
284 239
282 730
281 056
266 183
Lika-Senj
45 943
45 184
44 625
44 068
42 931
Virovitica-Podravina
77 086
75 257
73 641
72 378
70 648
Požega-Slavonia
69 583
67 862
66 256
65 134
64 384
Slavonski Brod-Posavina
143 827
140 072
137 487
135 483
130 844
Zadar
168 672
168 153
168 213
167 914
160 085
Osijek-Baranja
283 035
277 227
272 673
269 511
258 719
Šibenik-Knin
101 436
100 153
99 210
98 453
96 722
Vukovar-Sirmium
159 213
154 371
150 985
148 389
143 678
Split-Dalmatia
449 610
448 071
447 747
447 440
423 849
Istria
208 229
208 765
209 573
210 083
195 326
Dubrovnik-Neretva
121 381
121 215
121 816
122 571
115 714
Međimurje
110 999
109 921
109 232
108 822
105 393
City of Zagreb
802 762
804 507
807 254
809 268
768 054
1) Mid-2017, mid-2018, mid-2019 and mid-2020 population estimates were calculated on the basis of the 2011 Census. 2) Mid-2021 population estimate is calculated on the basis of the 2021 Census.
G-1 SHARE OF POPULATION IN COUNTIES IN TOTAL POPULATION OF REPUBLIC OF CROATIA, MID-2021 ESTIMATE
Source: Croatian Bureau of Statistics
2 AVERAGE AGE, AGEING INDEX AND FERTILE CONTINGENT OF POPULATION OF THE REPUBLIC OF CROATIA
Average age
Ageing index, %
Fertile contingent, 15 – 49, %
Total
Men
Women
Total
Men
Women
Women
1971
34,0
32,4
35,5
47,2
38,5
56,2
51,4
1981
35,4
33,8
37,1
52,6
40,4
65,3
48,5
1991
37,1
35,4
38,7
66,7
50,8
83,3
46,6
2001
39,3
37,5
41,0
90,7
71,6
110,8
46,9
2002
39,6
37,8
41,3
93,8
74,1
114,3
47,1
2003
39,9
38,1
41,5
96,2
76,1
117,2
46,9
2004
40,1
38,3
41,8
98,4
77,8
119,9
46,7
2005
40,3
38,5
42,0
99,6
78,7
121,5
46,4
2006
40,5
38,8
42,2
100,5
79,4
122,6
46,1
2007
40,8
39,0
42,4
103,1
81,7
125,5
45,8
2008
41,0
39,2
42,6
105,2
83,6
127,8
45,6
2009
41,1
39,4
42,8
107,6
85,8
130,4
45,3
2010
41,3
39,5
43,0
110,3
88,5
133,3
45,0
2011
41,8
40,0
43,5
115,7
92,9
139,7
43,8
2012
42,0
40,2
43,7
117,8
95,1
141,7
43,6
2013
42,2
40,3
43,9
121,0
98,0
145,2
43,4
2014
42,4
40,5
44,1
123,9
100,8
148,4
43,1
2015
42,6
40,7
44,3
127,5
104,1
152,2
42,8
2016
42,8
41,0
44,5
132,0
108,2
157,0
42,4
2017
43,1
41,3
44,8
136,9
112,8
162,3
41,9
2018
43,4
41,5
45,0
141,4
116,7
167,5
41,5
2019
43,6
41,8
45,3
145,4
120,5
171,8
41,1
2020
43,8
42,0
45,5
149,3
124,1
176,0
40,8
2021
44,3
42,5
45,9
155,6
130,2
182,5
40,0
G-2 SHARE OF POPULATION AGED 65 AND OVER IN TOTAL POPULATION, BY COUNTIES, MID-2021 ESTIMATE
Source: Croatian Bureau of Statistics
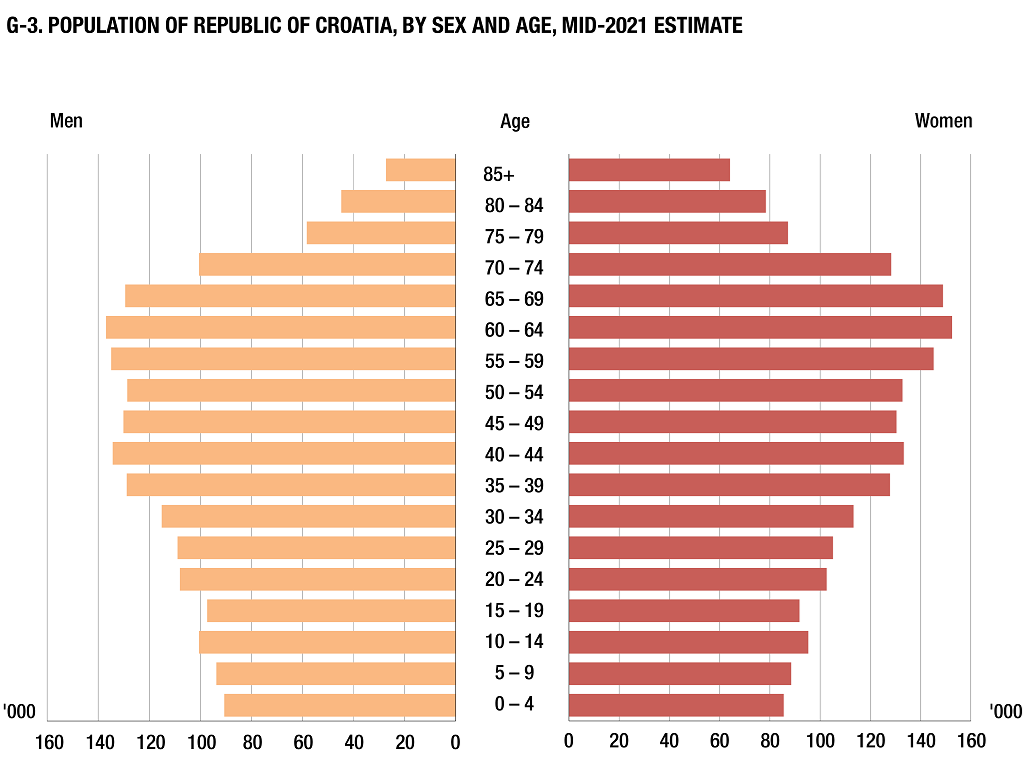
3 POPULATION ESTIMATE OF REPUBLIC OF CROATIA, BY SEX AND SINGLE AGE, MID-2021
(continued)
Age
Total
Men
Women
Age
Total
Men
Women
Total
3 878 981
1 867 955
2 011 026
0
35 172
18 288
16 884
43
53 242
26 600
26 642
1
35 086
18 006
17 080
44
52 559
26 314
26 245
2
35 319
17 945
17 374
45
52 601
26 252
26 349
3
35 143
18 257
16 886
46
51 943
26 013
25 930
4
35 319
18 044
17 275
47
51 730
25 818
25 912
5
34 539
17 566
16 973
48
51 678
25 899
25 779
6
35 899
18 452
17 447
49
52 500
26 096
26 404
7
36 490
18 797
17 693
50
49 669
24 677
24 992
8
37 223
19 393
17 830
51
50 384
24 852
25 532
9
38 029
19 451
18 578
52
51 892
25 480
26 412
10
38 283
19 755
18 528
53
53 696
26 394
27 302
11
40 644
20 806
19 838
54
55 799
27 192
28 607
12
39 767
20 285
19 482
55
56 899
27 577
29 322
13
39 589
20 233
19 356
56
55 525
26 841
28 684
14
37 554
19 373
18 181
57
54 125
26 274
27 851
15
38 274
19 684
18 590
58
56 207
26 911
29 296
16
39 443
20 365
19 078
59
57 342
27 273
30 069
17
36 921
18 966
17 955
60
57 498
27 324
30 174
18
36 842
19 008
17 834
61
58 608
27 925
30 683
19
37 602
19 304
18 298
62
58 241
27 686
30 555
20
38 785
20 001
18 784
63
56 756
26 602
30 154
21
40 691
20 892
19 799
64
58 260
27 385
30 875
22
41 617
21 340
20 277
65
58 586
27 457
31 129
23
43 746
22 297
21 449
66
59 423
27 949
31 474
24
45 801
23 483
22 318
67
54 594
25 415
29 179
25
44 187
22 593
21 594
68
55 649
25 681
29 968
26
42 590
21 616
20 974
69
50 024
22 887
27 137
27
42 000
21 173
20 827
70
49 411
22 391
27 020
28
42 940
21 876
21 064
71
49 586
22 191
27 395
29
42 322
21 648
20 674
72
46 140
20 115
26 025
30
44 645
22 656
21 989
73
41 467
17 828
23 639
31
44 023
22 220
21 803
74
42 202
18 005
24 197
32
45 476
22 841
22 635
75
28 330
11 774
16 556
33
47 238
23 759
23 479
76
27 629
11 349
16 280
34
47 016
23 631
23 385
77
29 485
11 727
17 758
35
48 275
24 020
24 255
78
30 180
11 871
18 309
36
51 035
25 611
25 424
79
29 845
11 593
18 252
37
52 549
26 562
25 987
80
28 214
10 790
17 424
38
52 046
26 148
25 898
81
27 327
10 131
17 196
39
52 689
26 453
26 236
82
24 244
8 792
15 452
40
53 568
26 943
26 625
83
22 741
7 974
14 767
41
54 027
27 129
26 898
84
20 636
7 129
13 507
42
54 196
27 283
26 913
85 +
91 514
27 368
64 146
4 POPULATION ESTIMATE, BY SEX AND AGE GROUPS, BY COUNTIES, MID-2021
Age groups
Republic of Croatia
County of Zagreb
County of Krapina-Zagorje
County of Sisak-Moslavina
Total
Men
Women
Total
Men
Women
Total
Men
Women
Total
Men
Women
Total
3 878 981
1 867 955
2 011 026
299 983
145 187
154 796
120 670
58 701
61 969
140 131
68 166
71 965
0 – 4
176 039
90 540
85 499
13 832
7 069
6 763
5 232
2 667
2 565
5 718
2 970
2 748
5 – 9
182 180
93 659
88 521
14 649
7 485
7 164
5 419
2 792
2 627
5 946
3 038
2 908
10 – 14
195 837
100 452
95 385
16 198
8 338
7 860
5 951
3 057
2 894
6 715
3 355
3 360
15 – 19
189 082
97 327
91 755
15 558
8 044
7 514
6 029
3 127
2 902
6 676
3 398
3 278
20 – 24
210 640
108 013
102 627
16 809
8 606
8 203
6 928
3 496
3 432
7 768
4 118
3 650
25 – 29
214 039
108 906
105 133
16 360
8 340
8 020
6 960
3 591
3 369
6 878
3 583
3 295
30 – 34
228 398
115 107
113 291
17 129
8 645
8 484
7 341
3 793
3 548
7 123
3 758
3 365
35 – 39
256 594
128 794
127 800
20 205
10 143
10 062
7 904
4 043
3 861
8 436
4 384
4 052
40 – 44
267 592
134 269
133 323
21 868
11 106
10 762
8 003
4 103
3 900
8 882
4 570
4 312
45 – 49
260 452
130 078
130 374
21 246
10 654
10 592
8 224
4 140
4 084
9 290
4 759
4 531
50 – 54
261 440
128 595
132 845
20 334
10 181
10 153
8 975
4 536
4 439
9 824
4 966
4 858
55 – 59
280 098
134 876
145 222
20 757
10 008
10 749
9 631
4 843
4 788
10 935
5 442
5 493
60 – 64
289 363
136 922
152 441
21 383
9 917
11 466
9 095
4 511
4 584
11 496
5 613
5 883
65 – 69
278 276
129 389
148 887
21 454
9 912
11 542
8 149
3 846
4 303
11 256
5 233
6 023
70 – 74
228 806
100 530
128 276
17 031
7 474
9 557
6 411
2 866
3 545
9 148
4 041
5 107
75 – 79
145 469
58 314
87 155
11 085
4 616
6 469
4 353
1 681
2 672
5 692
2 235
3 457
80 – 84
123 162
44 816
78 346
8 138
2 957
5 181
3 431
1 019
2 412
4 862
1 663
3 199
85 +
91 514
27 368
64 146
5 947
1 692
4 255
2 634
590
2 044
3 486
1 040
2 446
4 POPULATION ESTIMATE, BY SEX AND AGE GROUPS, BY COUNTIES, MID-2021
(continued)
Age groups
County of Karlovac
County of Varaždin
County of Koprivnica-Križevci
Total
Men
Women
Total
Men
Women
Total
Men
Women
Total
112 357
54 458
57 899
159 747
77 676
82 071
101 358
49 130
52 228
0 – 4
4 532
2 298
2 234
6 772
3 440
3 332
4 627
2 358
2 269
5 – 9
4 695
2 375
2 320
7 240
3 691
3 549
4 821
2 441
2 380
10 – 14
5 259
2 646
2 613
8 199
4 227
3 972
5 233
2 797
2 436
15 – 19
5 139
2 652
2 487
8 322
4 171
4 151
5 284
2 749
2 535
20 – 24
5 576
2 899
2 677
9 081
4 657
4 424
5 666
2 905
2 761
25 – 29
5 279
2 724
2 555
8 818
4 626
4 192
5 379
2 806
2 573
30 – 34
6 152
3 133
3 019
9 604
5 006
4 598
5 583
2 845
2 738
35 – 39
7 106
3 670
3 436
10 953
5 622
5 331
6 444
3 277
3 167
40 – 44
7 626
3 907
3 719
11 331
5 800
5 531
6 527
3 362
3 165
45 – 49
7 455
3 913
3 542
11 048
5 704
5 344
6 730
3 406
3 324
50 – 54
7 742
3 904
3 838
11 243
5 611
5 632
7 107
3 500
3 607
55 – 59
8 868
4 342
4 526
12 193
5 992
6 201
7 847
3 851
3 996
60 – 64
9 508
4 655
4 853
11 834
5 707
6 127
7 884
3 840
4 044
65 – 69
8 775
4 194
4 581
10 723
5 095
5 628
7 299
3 494
3 805
70 – 74
6 739
3 034
3 705
8 619
3 754
4 865
5 825
2 498
3 327
75 – 79
4 337
1 725
2 612
5 923
2 325
3 598
3 986
1 498
2 488
80 – 84
4 168
1 427
2 741
4 578
1 477
3 101
2 945
957
1 988
85 +
3 401
960
2 441
3 266
771
2 495
2 171
546
1 625
4 POPULATION ESTIMATE, BY SEX AND AGE GROUPS, BY COUNTIES, MID-2021
(continued)
Age groups
County of Bjelovar-Bilogora
County of Primorje-Gorski kotar
County of Lika-Senj
Total
Men
Women
Total
Men
Women
Total
Men
Women
Total
102 205
49 796
52 409
266 183
127 451
138 732
42 931
21 279
21 652
0 – 4
4 642
2 367
2 275
10 381
5 358
5 023
1 772
907
865
5 – 9
4 716
2 512
2 204
11 115
5 690
5 425
1 766
915
851
10 – 14
5 312
2 758
2 554
11 683
5 956
5 727
1 833
950
883
15 – 19
5 138
2 644
2 494
10 950
5 628
5 322
1 982
1 020
962
20 – 24
5 756
2 980
2 776
11 832
6 159
5 673
2 347
1 216
1 131
25 – 29
5 463
2 926
2 537
12 867
6 494
6 373
2 175
1 102
1 073
30 – 34
5 426
2 825
2 601
15 178
7 599
7 579
2 329
1 197
1 132
35 – 39
6 171
3 171
3 000
17 874
8 811
9 063
2 466
1 292
1 174
40 – 44
6 361
3 299
3 062
19 613
10 061
9 552
2 530
1 281
1 249
45 – 49
6 579
3 378
3 201
18 282
9 123
9 159
2 711
1 438
1 273
50 – 54
6 823
3 392
3 431
17 610
8 479
9 131
2 931
1 537
1 394
55 – 59
7 843
3 800
4 043
19 187
9 006
10 181
3 455
1 818
1 637
60 – 64
8 368
4 070
4 298
21 186
9 807
11 379
3 386
1 730
1 656
65 – 69
7 948
3 731
4 217
21 849
10 172
11 677
3 283
1 660
1 623
70 – 74
6 216
2 746
3 470
19 036
8 547
10 489
2 657
1 204
1 453
75 – 79
3 874
1 498
2 376
10 480
4 432
6 048
1 851
768
1 083
80 – 84
3 192
1 041
2 151
9 598
3 711
5 887
1 899
729
1 170
85 +
2 377
658
1 719
7 462
2 418
5 044
1 558
515
1 043
4 POPULATION ESTIMATE, BY SEX AND AGE GROUPS, BY COUNTIES, MID-2021
(continued)
Age groups
County of Virovitica-Podravina
County of Požega-Slavonia
County of Slavonski Brod-Posavina
Total
Men
Women
Total
Men
Women
Total
Men
Women
Total
70 648
34 117
36 531
64 384
31 333
33 051
130 844
63 694
67 150
0 – 4
3 086
1 544
1 542
2 858
1 481
1 377
5 693
2 972
2 721
5 – 9
3 233
1 649
1 584
2 972
1 509
1 463
6 108
3 141
2 967
10 – 14
3 660
1 903
1 757
3 425
1 809
1 616
6 898
3 587
3 311
15 – 19
3 663
1 913
1 750
3 517
1 804
1 713
7 261
3 831
3 430
20 – 24
4 098
2 102
1 996
3 952
2 064
1 888
8 069
4 186
3 883
25 – 29
3 678
1 874
1 804
3 493
1 808
1 685
6 997
3 649
3 348
30 – 34
3 758
1 957
1 801
3 279
1 725
1 554
6 987
3 660
3 327
35 – 39
4 366
2 243
2 123
3 749
1 885
1 864
7 486
3 813
3 673
40 – 44
4 548
2 327
2 221
3 892
1 939
1 953
7 727
3 854
3 873
45 – 49
4 369
2 144
2 225
4 105
2 083
2 022
8 218
4 118
4 100
50 – 54
4 939
2 435
2 504
4 407
2 210
2 197
8 999
4 484
4 515
55 – 59
5 856
2 846
3 010
4 984
2 487
2 497
10 440
5 118
5 322
60 – 64
5 948
2 873
3 075
5 121
2 532
2 589
10 603
5 116
5 487
65 – 69
5 223
2 494
2 729
4 826
2 301
2 525
9 763
4 689
5 074
70 – 74
4 072
1 799
2 273
3 678
1 618
2 060
7 257
3 202
4 055
75 – 79
2 612
948
1 664
2 515
924
1 591
5 117
2 013
3 104
80 – 84
2 027
668
1 359
2 194
742
1 452
4 216
1 413
2 803
85 +
1 512
398
1 114
1 417
412
1 005
3 005
848
2 157
4 POPULATION ESTIMATE, BY SEX AND AGE GROUPS, BY COUNTIES, MID-2021
(continued)
Age groups
County of Zadar
County of Osijek-Baranja
County of Šibenik-Knin
Total
Men
Women
Total
Men
Women
Total
Men
Women
Total
160 085
78 339
81 746
258 719
124 466
134 253
96 722
47 588
49 134
0 – 4
7 376
3 822
3 554
11 064
5 707
5 357
3 821
1 937
1 884
5 – 9
7 688
3 990
3 698
11 852
6 100
5 752
4 087
2 123
1 964
10 – 14
8 225
4 194
4 031
12 611
6 384
6 227
4 423
2 249
2 174
15 – 19
7 919
4 030
3 889
12 945
6 609
6 336
4 399
2 261
2 138
20 – 24
8 854
4 558
4 296
14 841
7 640
7 201
5 180
2 696
2 484
25 – 29
8 913
4 476
4 437
14 543
7 589
6 954
4 872
2 513
2 359
30 – 34
9 054
4 521
4 533
14 767
7 624
7 143
4 975
2 532
2 443
35 – 39
9 974
4 965
5 009
16 536
8 373
8 163
5 606
2 845
2 761
40 – 44
10 664
5 319
5 345
16 665
8 358
8 307
5 963
3 096
2 867
45 – 49
10 400
5 143
5 257
16 452
8 151
8 301
5 943
3 026
2 917
50 – 54
10 363
5 167
5 196
18 113
8 841
9 272
6 206
3 093
3 113
55 – 59
10 785
5 286
5 499
20 622
9 901
10 721
7 050
3 522
3 528
60 – 64
11 615
5 721
5 894
21 219
10 105
11 114
7 800
3 842
3 958
65 – 69
11 624
5 639
5 985
19 375
9 102
10 273
7 971
3 942
4 029
70 – 74
10 688
5 099
5 589
14 659
6 288
8 371
7 012
3 372
3 640
75 – 79
6 447
2 842
3 605
9 697
3 707
5 990
3 932
1 764
2 168
80 – 84
5 502
2 247
3 255
7 661
2 639
5 022
4 290
1 686
2 604
85 +
3 994
1 320
2 674
5 097
1 348
3 749
3 192
1 089
2 103
4 POPULATION ESTIMATE, BY SEX AND AGE GROUPS, BY COUNTIES, MID-2021
(continued)
Age groups
County of Vukovar-Sirmium
County of Split-Dalmatia
County of Istria
Total
Men
Women
Total
Men
Women
Total
Men
Women
Total
143 678
69 518
74 160
423 849
205 568
218 281
195 326
94 508
100 818
0 – 4
6 115
3 158
2 957
19 822
10 233
9 589
8 206
4 187
4 019
5 – 9
6 682
3 478
3 204
20 368
10 505
9 863
8 586
4 451
4 135
10 – 14
7 513
3 844
3 669
22 484
11 459
11 025
9 266
4 809
4 457
15 – 19
8 120
4 183
3 937
22 283
11 457
10 826
8 135
4 312
3 823
20 – 24
8 502
4 425
4 077
24 529
12 382
12 147
8 631
4 354
4 277
25 – 29
7 495
3 887
3 608
24 796
12 605
12 191
9 552
4 836
4 716
30 – 34
7 463
3 867
3 596
25 625
12 828
12 797
11 874
6 013
5 861
35 – 39
8 451
4 300
4 151
27 425
13 793
13 632
13 536
6 768
6 768
40 – 44
8 534
4 270
4 264
28 163
14 023
14 140
14 363
7 279
7 084
45 – 49
9 276
4 776
4 500
28 359
14 219
14 140
13 000
6 597
6 403
50 – 54
9 932
5 002
4 930
28 072
13 866
14 206
12 858
6 226
6 632
55 – 59
11 338
5 517
5 821
29 295
14 162
15 133
14 744
7 093
7 651
60 – 64
11 625
5 588
6 037
30 736
14 659
16 077
15 724
7 509
8 215
65 – 69
10 811
5 001
5 810
28 971
13 571
15 400
15 212
7 139
8 073
70 – 74
8 590
3 654
4 936
25 451
11 350
14 101
12 205
5 622
6 583
75 – 79
5 429
2 137
3 292
14 002
5 898
8 104
7 205
3 048
4 157
80 – 84
4 663
1 549
3 114
13 485
5 360
8 125
6 835
2 619
4 216
85 +
3 139
882
2 257
9 983
3 198
6 785
5 394
1 646
3 748
4 POPULATION ESTIMATE, BY SEX AND AGE GROUPS, BY COUNTIES, MID-2021
(continued)
Age groups
County of Dubrovnik-Neretva
County of Međimurje
City of Zagreb
Total
Men
Women
Total
Men
Women
Total
Men
Women
Total
115 714
56 605
59 109
105 393
51 566
53 827
768 054
358 809
409 245
0 – 4
5 693
2 880
2 813
5 522
2 841
2 681
39 275
20 344
18 931
5 – 9
5 905
3 003
2 902
5 589
2 933
2 656
38 743
19 838
18 905
10 – 14
6 162
3 145
3 017
5 805
2 980
2 825
38 982
20 005
18 977
15 – 19
5 521
2 885
2 636
5 726
2 956
2 770
34 515
17 653
16 862
20 – 24
6 338
3 295
3 043
5 898
3 062
2 836
39 985
20 213
19 772
25 – 29
6 654
3 438
3 216
5 717
3 004
2 713
47 150
23 035
24 115
30 – 34
7 144
3 619
3 525
6 090
3 073
3 017
51 517
24 887
26 630
35 – 39
7 606
3 858
3 748
6 971
3 624
3 347
57 329
27 914
29 415
40 – 44
7 810
4 051
3 759
7 198
3 629
3 569
59 324
28 635
30 689
45 – 49
7 433
3 825
3 608
6 955
3 519
3 436
54 377
25 962
28 415
50 – 54
7 534
3 725
3 809
6 797
3 365
3 432
50 631
24 075
26 556
55 – 59
7 706
3 635
4 071
7 731
3 736
3 995
48 831
22 471
26 360
60 – 64
8 230
3 998
4 232
7 803
3 809
3 994
48 799
21 320
27 479
65 – 69
8 089
3 810
4 279
7 296
3 580
3 716
48 379
20 784
27 595
70 – 74
6 953
3 157
3 796
5 500
2 510
2 990
41 059
16 695
24 364
75 – 79
4 045
1 746
2 299
3 851
1 578
2 273
29 036
10 931
18 105
80 – 84
3 849
1 586
2 263
2 797
865
1 932
22 832
8 461
14 371
85 +
3 042
949
2 093
2 147
502
1 645
17 290
5 586
11 704
NOTES ON METHODOLOGY
Data sources
The following surveys are the data sources for the population estimate of the Republic of Croatia:
- 2011 Census of Population, Households and Dwellings
- 2021 Census of Population, Households and Dwellings
- birth statistics
- death statistics
- statistics of the internal migration of population
- statistics of the international migration of population.
Population estimates for 2017, 2018, 2019 and 2020 have been done on the basis of the census data collected in the 2011 Census of Population, Households and Dwellings.
Population estimate for 2021 is done on the basis of the census data collected in the 2021 Census of Population, Households and Dwellings.
The data on births are collected through the Statistical Report on Births (DEM-1) for every entry in the State birth register.
The data on deaths are collected through the Statistical Report on Deaths (DEM-2) for every entry in the State death register.
The surveys on the internal and international migration of population are based on data collected by the Ministry of the Interior.
Coverage
The population estimates data for 2017, 2018, 2019 and 2020 published in this First Release encompasses all persons included in the total population of the Republic of Croatia in the 2011 Census of Population, Households and Dwellings, all who were born and entered into the State birth register in the period from 1 April 2011 to the estimate date, all persons who died and were entered into the State death register in the period from 1 April 2011 to the estimate date and all persons who immigrated from abroad or emigrated to abroad, as well as persons who migrated inside the territory of the Republic of Croatia in the period from 1 April 2011 to the estimate date.
The population estimate data for 2021 published in this First Release encompasses all persons included in the total population of the Republic of Croatia in the 2021 Census of Population, Households and Dwellings, all who were born and entered into the State birth register from 1 July 2021 to 31 August 2021, all persons who died and were entered into the State death register from 1 July 2021 to 31 August 2021 and all persons who immigrated from abroad or emigrated abroad, as well as persons who migrated inside the territory of the Republic of Croatia from 1 July 2021 to 31 August 2021.
Definitions and explanations
Mid-2017, mid-2018, mid-2019 and mid-2020 population estimates were calculated on the basis of the 2011 Census, natural change and net migration data.
Mid-2021 population estimate is calculated on the basis of the 2021 Census, natural change and net migration data.
In the 2011 Censusand 2021 Census, according to the international statistical standards, the concept of the place of usual residence is used in defining the total population. The place of usual residence is considered a place where a person spends most of his/her daily time, irrespective of a short-term absence from it (e.g. due to going on a vacation, trip, medical treatment, visit etc.). In line with the definition of the place of usual residence, the total population includes the following persons:
- those who have lived in their place of usual residence for a continuous period of at least 12 months before the census moment
- those who arrived in their place of usual residence during the 12 months before the census moment with the intention of staying there for at least one year.
A live born child(live birth) is every child who at birth exhibits signs of life, such as breathing, beating of the heart, pulsation of the umbilical cord or definite movements of voluntary muscles.
A deceased person (death) is every live born person in whom there is a permanent disappearance of all evidence of life.
Natural increase is the difference between the number of live births and the number of deaths.
Data by age are expressed by completed years of age on the referent date. The data by age groups include persons who reached the age within the limits of an interval.
Average age indicates the mean age of the total population and it is calculated as the arithmetic mean of the age of the total population.
Ageing index represents the ratio of the population, that is, the share (%) of inhabitants aged 60 and over in the number of inhabitants aged from 0 to 19 inclusive.
Fertile female population includes women between 15 and 49 years of age.
Place of permanent residence, according to Article 2 of the Permanent Residence Act (NN, Nos 144/12 and 158/13) is "a place and address in the Republic of Croatia where a person settled with an intention of staying permanently in order to exercise their rights and commitments related to life interests such as family, professional, economic, social, cultural and other interests".
Immigrated or emigrated population is the population that changed their place of usual residence on the territory of the Republic of Croatia or that changed their country of usual residence for a period that is, or is expected to be, of at least one year.
Net migration of population (migration balance) is the difference between the number of immigrants and the number of emigrants of a particular area or country in a given period of time.
Territorial constitution
The data are presented by territorial constitution according to the Act on Territories of Counties, Towns and Municipalities in the Republic of Croatia (NN, No. 86/06), with the situation as on 31 December 2021.
Abbreviations
NN
Narodne novine, official gazette of the Republic of Croatia
'000
thousand
Published by the Croatian Bureau of Statistics, Zagreb, Ilica 3, P. O. B. 80. Phone: (+385 1) 48 06 111 Press corner: press@dzs.hr
Persons responsible: Dubravka Rogić-Hadžalić, Director of Demographic and Social Statistics Directorate Lidija Brković, Director General
Prepared by: Tatjana Radić and Andrea Zebec
USERS ARE KINDLY REQUESTED TO STATE THE SOURCE.
Customer Relations and Data Protection Department
Information and user requests Phone: (+385 1) 48 06 138, 48 06 154 E-mail: stat.info@dzs.hr