First Release
CONSUMER PRICE INDICES, DECEMBER 2021
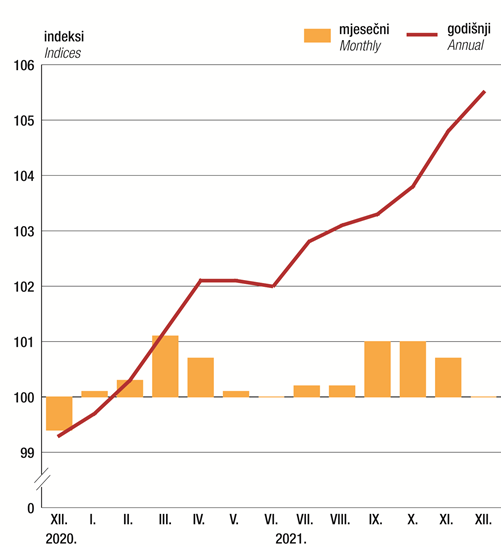
In December 2021, as compared to November 2021, the prices of goods and services for personal consumption, measured by the consumer price index, remained at the same level on average. As compared to December 2020, that is, at the annual level, they increased by 5.5% on average, while on the annual average they increased by 2.6%.
Viewed by main groups by purpose of consumption, in December 2021, as compared to November 2021, the highest increase was recorded in the prices of Food and non-alcoholic beverages, by 1.4% on average, in the prices of Furnishings, household equipment and routine household maintenance as well as in the prices of Miscellaneous goods and services, by 0.7% (in each group) on average, in the prices of Transport as well as in the prices of Restaurants and hotels, by 0.4% (in each group) on average, in the prices of Recreation and culture, by 0.3% on average, and in the prices of Alcoholic beverages and tobacco, by 0.1% on average.
The increase in the consumer price indices in December 2021, as compared to November 2021, was alleviated by a decrease of 8.2% on average in the prices of Clothing and footwear and of 0.2% on average in the prices of Housing, water, electricity, gas and others fuels.
At the same time, in December 2021, as compared to November 2021, the prices of Health, the prices of Communication and the prices of Education remained on average at the November 2021 level.
The prices of Food and non-alcoholic beverages (by 0.38%) contributed the most to the increase in the consumer price indices in December 2021, as compared to November 2021, while the prices of Clothing and footwear contributed the most to their decrease (by -0.47%).
1 CONSUMER PRICE INDICES, DECEMBER 2021 |
|||||||||||||||||||||||||||||||||||||||||||||||||||||||||||||||||||||||||||||||||||||||||||||||||||||||||||||||||||||||||||||||||||||||||||||||||||||||||||||||||||||||||||||||||||||||||||||||||||||||||||||||||||||||||||||||||||||||||||||||||||||||||||||||||||||||||||||||||||||||||||||||||||||||||||||||||||||||||||||||||||||||||||||||||||||||||||||||||||||||||||||||||||||||||||||||||||||||||||||||||||||||||||||||||||||||||||||||||||||||||||||||||||||||||||||||||||||||||||||||||||||||||||||||||||||||||||||||||||||||||||||||||||||||||||||||||||||||||||||||||||||||||||||||||||||||||||||||||||||||||||||||||||||||||||||||||||||||||||||||||||||||||||||||||||||||||||||||||||||||||||||||||||||||||||||||||||||||||||||||||||||||||||||||||||||||||||||||||||||||||||||||||||||||||||||||||||||||||||||||||||||||||||||||||||||||||||||||||||||||||||||||||||||||||||||||||||||||||||||||||||||||||||||||||||||||||||||||||||||||||||||||||||
|
G-1 MONTHLY CONSUMER PRICE INDICES, DECEMBER 2021
2 CONSUMER PRICE INDICES, BY SELECTED GROUPS, DECEMBER 2021 |
||||||||||||||||||||||||||||||||||||||||||||||||||||||||||||||||||||||||||||||||||||||||||
|
3 CONSUMER PRICE INDICES |
||||||||||||||||||||||||||||||||||||||||||||||||||||||||||||||||||||||||||||||||||||||||||||||||||||||||||||||||||||||||||||||||||||||||||||||||||||||||||||||||||||||||||||||||||||||||||||||||||||||||||||||||||||||||||||||||||||||||||||||||||||||||||||||||||||||||||||||||||||||||||||||||||||||||||||||||||||||||||||||||||||||||||||||||||||||||||||||||||||||||||||||||||||||||||||||||||||||||||||||||||||||||||||||||||||||||||||||||||||||||||||||||||||||||||||||||||||||||||||||||||||||||||||||||||||||||||||||||||||||||||||||||||||||||||||||||||||||||||||||||||||||||||||||||||||||||||||||||||||||||||||||||||||||||||||||||||||||||||||||||||||||||||||||||||||||||||||||||||||||||||||||||||||||||||||||||||||||||||||||||||||||||||||||||||||||||||||||||||||||||||||||||||||||||||||||||||||||||||||||||||||||||||||||||||||||||||||||||||||||||||||||||||||||||||||||||||||||||||||||||||||||||||||||||||||||||||||||||||||||||||||||||||||||||||||||||||||||||||||||||||||||||||||||||||||||||||||
|
Ø 2015 = 100
1) See Notes on Methodology. |
||||||||||||||||||||||||||||||||||||||||||||||||||||||||||||||||||||||||||||||||||||||||||||||||||||||||||||||||||||||||||||||||||||||||||||||||||||||||||||||||||||||||||||||||||||||||||||||||||||||||||||||||||||||||||||||||||||||||||||||||||||||||||||||||||||||||||||||||||||||||||||||||||||||||||||||||||||||||||||||||||||||||||||||||||||||||||||||||||||||||||||||||||||||||||||||||||||||||||||||||||||||||||||||||||||||||||||||||||||||||||||||||||||||||||||||||||||||||||||||||||||||||||||||||||||||||||||||||||||||||||||||||||||||||||||||||||||||||||||||||||||||||||||||||||||||||||||||||||||||||||||||||||||||||||||||||||||||||||||||||||||||||||||||||||||||||||||||||||||||||||||||||||||||||||||||||||||||||||||||||||||||||||||||||||||||||||||||||||||||||||||||||||||||||||||||||||||||||||||||||||||||||||||||||||||||||||||||||||||||||||||||||||||||||||||||||||||||||||||||||||||||||||||||||||||||||||||||||||||||||||||||||||||||||||||||||||||||||||||||||||||||||||||||||||||||||||||
4 CONSUMER PRICE INDICES, TOTAL |
||||||||||||||||||||||||||||||||||||||||||||||||||||||||||||||||||||||||||||||||||||||||||||||||||||||||||||||||||||||||||||||||||||||||||||||||||||||||||||||||||||||||||||||||||||||||||||||||||||||||||||||||||||||||||||||||||||||||||||||||||||||||||||||||||||||||||||||||||||||||||||||||||||||||||||||||||||||||||||||||||||||||||||||||||||||||||||||||||||||||||||||||||||||||||||||||||||||||||||||||||||||||||||||||||||||||||||||||||||||||||||||||||||||||||||||||||||||||||||||||||||||||||||||||||||||||||||||||||||||||||||||||||||||||||||||||||||||||||||||||||||||||||||||||||||||||||||||||||||||||||||||||||||||||||||||||||||||||||||||||||||||||||||||||||||||||||||||||||||||||||||||||||||||||||||||||||||||||||||||||||||||||||||||||||||||||||||||||||||||||||||||||||||||||||||||||||||||||||||||||||||||||||||||||||||||||||||||||||||||||||||||||||||||||||||||||||||||||||||||||||||||||||||||||||||||||||||||
|
||||||||||||||||||||||||||||||||||||||||||||||||||||||||||||||||||||||||||||||||||||||||||||||||||||||||||||||||||||||||||||||||||||||||||||||||||||||||||||||||||||||||||||||||||||||||||||||||||||||||||||||||||||||||||||||||||||||||||||||||||||||||||||||||||||||||||||||||||||||||||||||||||||||||||||||||||||||||||||||||||||||||||||||||||||||||||||||||||||||||||||||||||||||||||||||||||||||||||||||||||||||||||||||||||||||||||||||||||||||||||||||||||||||||||||||||||||||||||||||||||||||||||||||||||||||||||||||||||||||||||||||||||||||||||||||||||||||||||||||||||||||||||||||||||||||||||||||||||||||||||||||||||||||||||||||||||||||||||||||||||||||||||||||||||||||||||||||||||||||||||||||||||||||||||||||||||||||||||||||||||||||||||||||||||||||||||||||||||||||||||||||||||||||||||||||||||||||||||||||||||||||||||||||||||||||||||||||||||||||||||||||||||||||||||||||||||||||||||||||||||||||||||||||||||||||||||||||
5 ANNUAL AVERAGE CONSUMER PRICE INDICES, TOTAL |
|||||||||||||||||||||||||||||||||||||||||||||||||||||||||||||||||||||||||||||||||||||||||||
|
G-2 MONTHLY AND ANNUAL CONSUMER PRICE INDICES, DECEMBER 2020 ‒ DECEMBER 2021
|
|
6 HARMONISED INDICES OF CONSUMER PRICES, DECEMBER 2021, RATES OF CHANGE |
||||||||||||||||||||||||||||||||||||||||||||||||||||||||||||||||||||||||||||||||||||||||||||||||||
1) Indices (according to the Commission Regulation (EU) No. 2015/2010 of 11 November 2015, common index reference period for the HICP is 2015 = 100). |
7 HARMONISED INDICES OF CONSUMER PRICES IN EU, NOVEMBER 20211) |
||||||||||||||||||||||||||||||||||||||||||||||||||||||||||||||||||||||||||||||||||||||||||
1) Source: Eurostat, Euro-indicators, News Release for November 2021, No. 142/2021 of 17 December 2021. |
||||||||||||||||||||||||||||||||||||||||||||||||||||||||||||||||||||||||||||||||||||||||||
NOTES ON METHODOLOGY
Consumer price index
Definition
The consumer price index (CPI) measures changes in the prices of goods and services acquired, used or paid over time by the reference population (private households) for consumption purposes.
Purpose
The CPI can be used for various purposes. It can be used as a measure of inflation, it can serve to guarantee the value of recurrent payments in escalator clauses for contractual relationships (for example, the CPI can serve for indexing wages and salaries in collective agreements, for indexing pensions etc.), as well as a comparison of the price movements within a particular country between different economy sectors, it can serve as a basis for deflating the national accounts data and other statistical series and can be used for analytical purposes.
Scope
The CPI in the Republic of Croatia is calculated on the basis of a representative basket consisting of about 890 different items. About 38 000 prices are collected each month in a fixed panel of outlets in nine geographical locations.
Population coverage. All private households in the country, regardless of type of settlements, position in income distribution or their ethnic and demographic characteristics are covered.
Geographic coverage. The weight structure covers the whole territory of the Republic of Croatia. The pricing takes place in nine locations (cities and towns) throughout the country (Zagreb, Slavonski Brod, Osijek, Sisak, Rijeka, Pula, Split, Dubrovnik and Varaždin), sampled on the basis of the size of the population and representativeness at NUTS 2 level.
Product coverage. All goods and services bought by the reference population for the purpose of final consumption are included in the index. Imputed rents, expenditures on lotteries and gambling as well as life insurance are not included. The coverage of goods and services is regularly revised in order to ensure the representativeness of the basket with respect to consumer tastes and purchasing practices. Products have to be included in the calculation of the index once their expenditure share exceeds 1/1000 of the total expenditures of the reference population.
Price collection
Most of the prices are collected locally, while the central price collection is applied to nationally homogeneous prices. For products for which prices are collected locally, the price collectors receive loose specifications and they are free to initially select a particular product for pricing in a particular outlet. In order to make sure that the same products are then re-priced each month, as well as to monitor which products are selected for pricing, the price collectors also record a pre-defined set of additional product characteristics. Such a method of price collection enables the monitoring of price change between two periods, but not the comparison of average prices between different geographic locations.
For the purpose of the CPI, most prices are recorded monthly, on working days (prices are not recorded during weekends and public holidays) on approximately the same day of the month (between 13th and 23rd day of the reference month). Prices of agricultural products sold in market places and prices of passenger air transport are recorded twice a month. Prices of fuel for passenger cars, prices of package holidays, prices of apartment rents and prices of accommodations in camps are recorded weekly. Prices of market rents are recorded quarterly, while prices of education fees and prices of school books are recorded once a year.
Weights
The weights used for calculating the CPI reflect the relative importance of the sampled goods or services in the total consumption of resident households within the domestic territory.
The most important data source for calculating the weights used in the consumer price indices is the Household Budget Survey, conducted on a regular basis by the Croatian Bureau of Statistics since 1998. The data collected by these surveys are supplemented by available administrative data. Since January 2021, the compilation of the CPIs has been based on the weights derived from data on household expenditures from the 2017 Household Budget Survey recalculated to December 2020 prices.
The COVID-19 pandemic has largely affected household personal consumption and therefore, for the calculation of weights in 2021, data from the 2017 Household Budget Survey were further updated with estimated national accounts data on household final consumption expenditure for 2020.
At the same time, estimated national accounts data on household final consumption expenditure for 2020 were used to calculate the weights for the harmonised consumer price index, supplemented by additional available data sources and recalculated to the difference between the 2020 average and December 2020 according to the Eurostat recommendations.
Classification
The classification of products used in the CPI is based on the European Classification of Individual Consumption according to Purpose (ECOICOP).
Calculation of indices
The calculation of the CPIs begins with the computation of the elementary aggregate indices.
The elementary aggregate indices are compiled as a ratio of the geometric means of prices for each geographical location. It means that prices for product-offers within elementary aggregates in the current month are compared to prices of the reference period (December of the previous year). From elementary indices at the level of geographical locations, elementary aggregate indices at national level are then calculated by using the formula for the weighted arithmetic mean.
Elementary aggregate indices at national level are aggregated to higher index levels using the Laspeyres’ type formula.
Treatment of seasonal products
In calculating the index for seasonal products, the Commission Regulation (EC) No. 330/2009 of 22 April 2009 (minimum standards for seasonal products) applies.
Harmonised index of consumer prices
Definition
The harmonised index of consumer prices (HICP) is an economic indicator that measures the change in the prices of goods and services acquired, used or paid by households over time. As such, it represents a group of European consumer price indices calculated according to the harmonised approach and a separate set of definitions and provides a comparable measure of inflation in the euro area, the European Union, the European Economic Area and the candidate countries.
Difference between the consumer price index and the harmonised index of consumer prices
While the consumer price index is mostly used as a general measure of inflation in the national context, the harmonised index of consumer prices represents a comparable measure of inflation in the European Union.
Both HICP and CPI are calculated on the basis of the same representative basket of goods and services. The main difference in relation to the consumer price index is in population coverage and the sources for the weighting structure.
HICP covers the total consumption of non-residents and institutional households within the economic territory of a country. This type of consumption is not included in the national CPI.
The main data source for the calculation of the HICP weight structure at higher aggregation levels are the data obtained from the National Accounts, while the Household Budget Survey data are used at lower aggregation levels.
The Croatian Bureau of Statistics has been calculating HICP since January 2007. As is true of national consumer price indices, the series of the harmonised indices of consumer prices was also backcasted to January 1998, when the COICOP classification had started being used.
The harmonised index of consumer prices and metadata for the Croatian HICP are available on the Eurostat web page http://ec.europa.eu/eurostat/.
Harmonised index of consumer prices at constanttax rates
HICP-CT is the harmonised index of consumer prices where the rates of taxes on products are kept constant in the observation period compared to the reference period, i.e. through time. In the event of a tax rate change, the difference between the current HICP-CT and HICP would indicate the effect of the tax rate change on price changes assuming tax changes are passed on instantaneously and fully.
Monthly indices, monthly rates of change and annual rates of change of the HICP-CT are available at Eurostat’s web page http://ec.europa.eu/eurostat.
Data for total index are available on the web page of the Croatian Bureau of Statistics http://www.dzs.hr (Statistics in Line).
Harmonised index of consumer prices – administered prices
The HICP – administered prices (HICP-AP) provides a summary of the development of fully administered prices and of mainly administered prices.
The Croatian Bureau of Statistics carries out an annual update of fully and mainly administrative prices on which the Eurostat calculates the following special index aggregates for all EU member states on a monthly basis:
HICP of administered prices, of fully administered prices and of mainly administered prices
HICP all-items excluding administered prices, excluding fully administered prices and excluding mainly administered prices.
The HICP-AP data are available on the Eurostat web page http://ec.europa.eu/eurostat/ where, for the period from 2001 onwards, metadata is also available by countries of the sub-indices of COICOP, which are classified as administrative.
Other definitions
Elementary aggregates are products at the lowest aggregation level, that is, products in all outlets on one geographical location. The data required for the estimation of weights are typically not available within an elementary aggregate.
Products are all consumer goods or services that can be purchased; the term covers both goods and services.
Goods are products excluding services.
Energy includes electricity, gas, liquid and solid fuels, heat energy, fuels and lubricants.
An annual index measures the price change between the current month and the same month of the previous year. This measure is responsive to recent changes in price levels but can be influenced by one-off effects in either month.
A twelve-month average index overcomes this volatility by comparing the average in the last 12 months to the average of the previous 12 months.
Abbreviations
| COICOP | Classification of Individual Consumption by Purpose |
| COVID-19 | COrona VIrus Disease-19 |
| EC | European Community |
| EU | European Union |
| Eurostat | Statistical Office of the European Communities |
| n. e. c. | not elsewhere classified |
| NUTS | common classification of territorial units for statistics |
Symbols
- no occurrence
Published by the Croatian Bureau of Statistics, Zagreb, Ilica 3, P. O. B. 80
Phone: +385 (0) 1 4806-111, Fax: +385 (0) 1 4817-666
Press corner: press@dzs.hr
Persons responsible:
Suzana Šamec, načelnica Sektora makroekonomskih statistika
Lidija Brković, Director General
Prepared by:
Sanja Jurleka, Jasminka Stančić, Snježana Strukar, Marita Novoselec,
Marija Gudelj, Gordana Šiletić i Ivana Ključarić
USERS ARE KINDLY REQUESTED TO STATE THE SOURCE.
Customer Relations and Data Protection Department
Information and user requests
Phone: (+385 1) 4806-138, 4806-154
E-mail: stat.info@dzs.hr
Fax: (+385 1) 4806-148
Subscription
Phone: (+385 1) 4806-115
E-mail: prodaja@dzs.hr
Fax: (+385 1) 4806-148
Ilica 3, 10 000 Zagreb
Republic of Croatia
Phone: (+385 1) 48 06 111
E-Mail: stat.info@dzs.hr
Copyright © 2024 Republic of Croatia - Croatian Bureau of Statistics